
cost-xray
Cost Xray shows what Claude Code and Codex send to the API, how much context each source uses, and what every part costs.

See the system prompt, tool schemas, MCP servers, messages, cache activity, tool results, and model output behind each request.
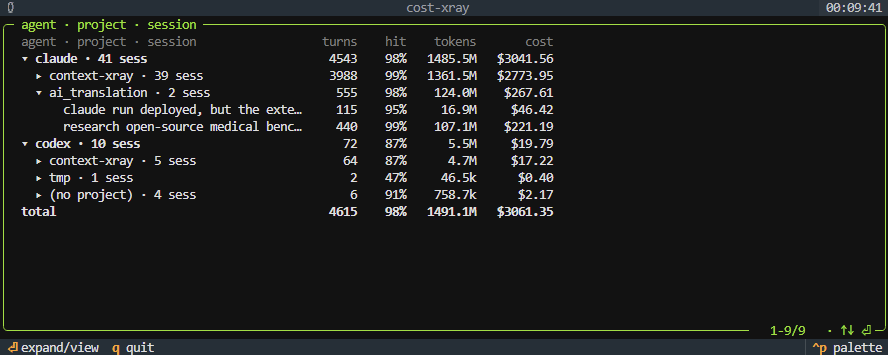
Token and dollar totals for every session, organized by agent and project.
Drill a session
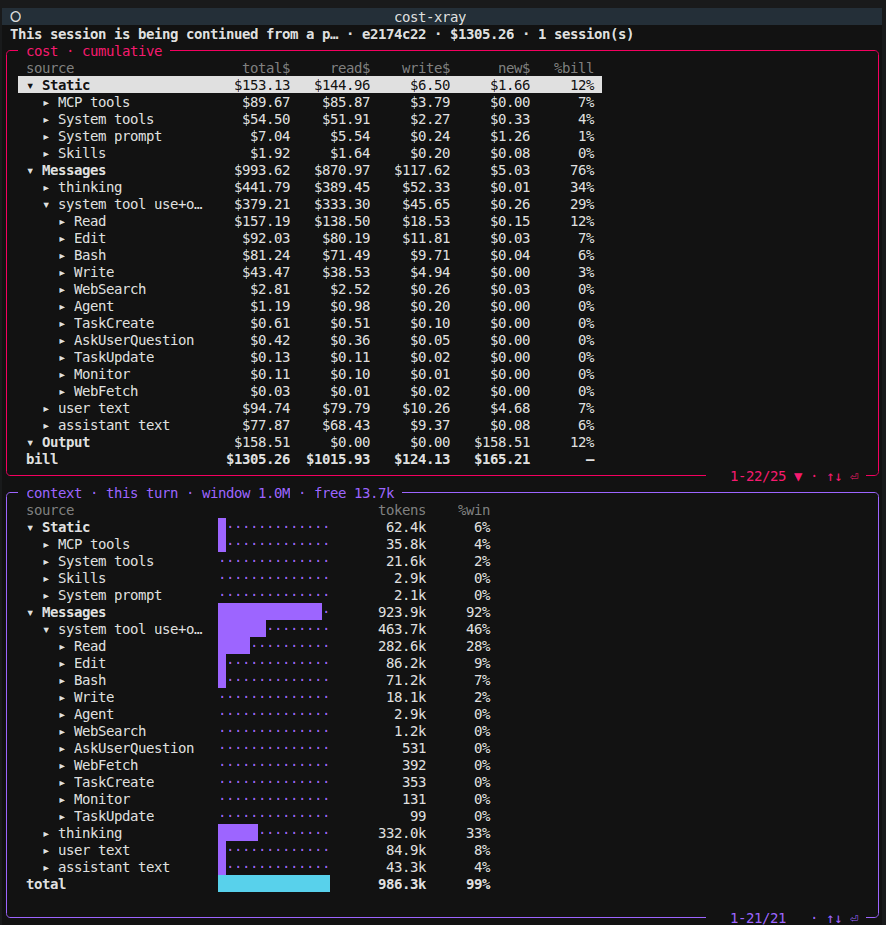
context-window occupancy (bottom) and per-source cost, down to each MCP server (top)
Go beyond session totals
Most usage tools read local logs. They can show what a session cost, but not everything assembled before the API call.
| System | What it answers |
|---|---|
| Usage logs | How much did the session cost? |
| Agent transcripts | What happened during the session? |
| Cost Xray | What did the model receive, and what made it expensive? |
Cost Xray captures the actual local API traffic, then traces tokens and cost back to the source that caused them.
How it works
Cost Xray runs mitmproxy as a local capture hop and keeps all analysis off the request path: agent traffic passes through the local proxy on its way to the model API, redacted raw requests and responses land under ~/.cost-xray/sessions/, and a separate materializer turns them into the TUI and cost attribution.
Capture.
A transparent local hop — no API keys, no account, no config changes to your agent. The wrapper self-heals: if the proxy is down, the agent runs direct — capture never breaks your agent.
Local & private.
The proxy binds to 127.0.0.1 and sends no telemetry. Keys, cookies, and secret-looking fields are redacted before anything hits disk. Everything stays under \~/.cost-xray/.
Off the hot path.
The proxy only writes redacted bytes; a separate materializer tokenizes and prices later, so analysis never steals latency from live relay.
Get Started
curl -fsSL https://raw.githubusercontent.com/tigerless-labs/cost-xray/master/install.sh | bashThen open a new terminal and run claude / codex exactly as before — capture is automatic, no flags and no base-URL change.
Open the live TUI from anywhere:
cxIn the TUI, drill from the top down:
- agent
- project
- session
- category
- MCP server
- tool
- per-turn call
- the real output.

Pause anytime with cx stop.
More in the works — built in the open, shipped fast.
 Explore Tigerless Labs